
Stitch Fix (SFIX): A Stock You Should Keep Out of Your Portfolio
Written by Ashwit Mathur


Overview:
As investors, we often view stocks in a binary wayᅳeither as failures or successesᅳprimarily seeking those that promise the highest returns. Most articles published by major corporations will pitch you new stocks to buy, however, today I want to focus on a stock that I think is headed for failure, rather than success. By examining a stock that seems poised to nosedive, we will learn how to identify key metrics and indicators of stocks that have little room to succeed.
About the Company:
Stitch Fix is an online personal styling service that leverages a combination of data science, artificial intelligence, and live fashion experts to curate customized apparel boxes shipped to your front door. Stitch Fix was founded in 2011 by Katrina Lake with the mission to help people save time, look their best, and evolve their style over time.
Figure 1.1 - Stitch Fix’s Business Model

Competitive Analysis:
Perhaps the first step to take when examining if a company, and in turn, its stock will succeed is taking a look at the industry it operates in and where it lands relative to competitors. The two main analysis methods you will need for this are Porter’s 5 Forces Analysis and the MOAT Analysis.
Figure 1.2 - Porter’s 5 Forces for SFIX
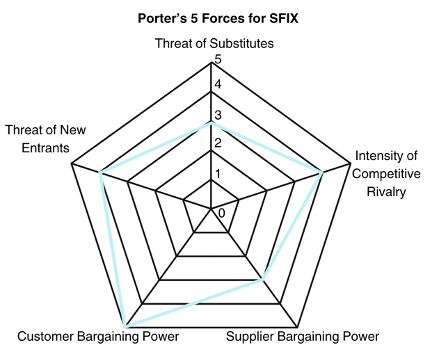
Let’s start with Porter’s 5 Forces Analysis for Stitch Fix. The 5 Forces are: Competitive Rivalry (High - 4 out of 5), Supplier Bargaining Power (Moderate - 3 out of 5), Consumer Bargaining Power (High - 5 out of 5), Threat of Substitutes (Moderate - 3 out of 5), and Threat of New Entrants (High - 4 out of 5).
These values were computed from research on the industry using online sources as well as examining analyst reports. Once you have your basic values and justifications for Porter’s 5 Forces, you can create the Porter’s 5 Forces Pentagon Framework. Stitch Fix’s Porter’s 5 Forces Framework highlights the major threats to Stitch Fix and underscores potential challenges the business may face within the industry.
MOAT Analysis:

Moving on, let’s discuss Stitch Fix’s MOAT Analysis. The MOAT Analysis is a valuable tool for determining if a business has any differentiability compared to its competitors. Some examples of possible economic moats include economies of scale, network effect, IP protection, cost advantage, etc.
Stitch Fix’s main source of an economic moat is its protection over its intellectual properties such as the use of patents by Stitch Fix, protecting its proprietary AI algorithm. However, Stitch Fix lacks other moats, and for this reason, I have assigned them a narrow economic moat which is generally not a good sign for investment.
Based on Stitch Fix’s narrow moat and the intensity of competition in the industry as highlighted by Porter’s 5 Forces Analysis, investing in Stitch Fix already seems like a major risk. However, to affirm this let’s analyze Stitch Fix’s financials.
To analyze a company financially, the options are seemingly endless. Some people may simply look at balance sheets, income statements, and cash flow statements and value a company from there, whereas more seasoned investors may create complex financial models to forecast growth. The truth is, no financial model works for everyone with a 100% accuracy rate, and that’s why knowing your investment strategy is vital for making educated investments.
EV/EBITDA Ratio — Indicator #1
For now, I will explain a few basic metrics and apply them to Stitch Fix to give you a sense of some basic financial analysis techniques. First, let’s take a look at Stitch Fix’s EV/EBITDA ratio. This value provides insight into a company’s enterprise value relative to its EBITDA, which stands for earnings before interest, taxes, depreciation, and amortization. Stitch Fix’s current EV/EBITDA is -1.95.
The fact that this value is negative signifies that Stitch Fix’s earnings are not enough to cover its operating expenses, and as a result, the business is currently making severe losses.
Return on Equity (ROE) — Indicator #2
Another value we can examine is Stitch Fix’s Return on Equity (ROE). The ROE value signifies how much profit a company is making relative to total shareholder equity. Usually, a high positive return on equity is a positive sign for investment, as it demonstrates that the business can make actual returns from investments.
Currently, Stitch Fix has a ROE of -53.76%. This is a major red flag as Stitch Fix is generating a loss equivalent to 50% of the shareholders' equity. As investors, we do not want to invest in a company that is making such severe losses. Based on this metric, a prospective investment in Stitch Fix would yield a major loss to investors.
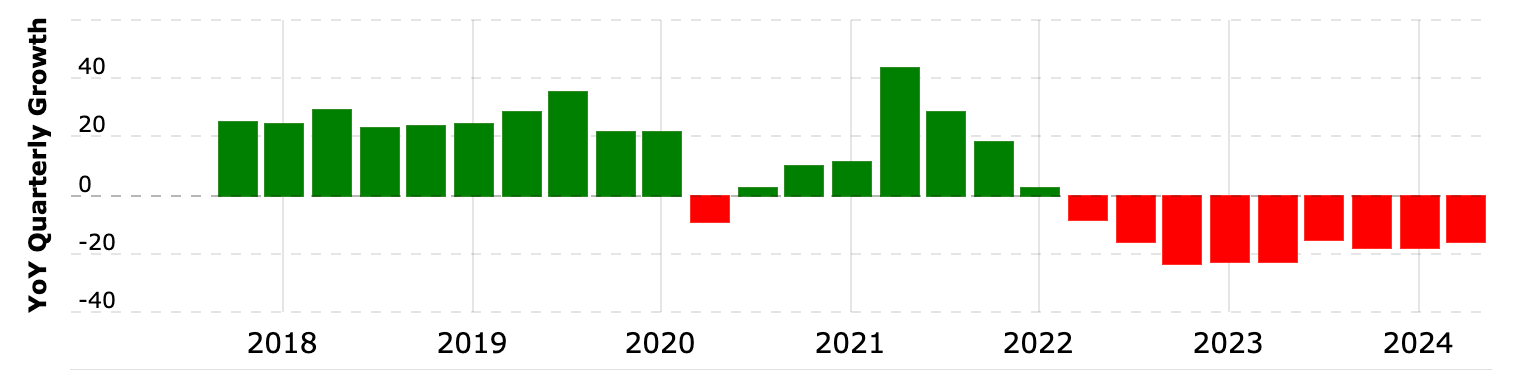
Figure 1.3 - Stitch Fix’s Declining Revenues
Limitations:
As with any equity analysis, my inspection of Stitch Fix is purely based on my opinion and my research. In reality, Stitch Fix could end up turning their business around by cutting costs and increasing profitability through AI innovation, which are possibilities for growth for the company. Additionally, Stitch Fix recently beat analyst earnings on June 4th, causing their stock to rally and investor confidence to increase. This could potentially be a catalyst for growth and lead the stock to grow further as well.
Conclusion:
However, based on the competitive and financial analysis we conducted today, my investment thesis remains the same: do not invest in Stitch Fix. I hope that this case study of Stitch Fix helped you learn some of the basic signs to look for when investing in a stock. Remember, as long as you follow your basic investing principles, you can be a successful investor!
If you made it this far, consider subscribing to Skip the Jargon. Our publication thrives because of viewers like you! :)
Ashwit Mathur is a rising senior from BASIS Independent Silicon Valley in San Jose, CA. He is passionate about investing and enjoys playing table tennis and baking in his free time.
Please Note:
This article was written purely for educational purposes. Skip the Jargon or any of its associated initiatives do not provide tax, legal, accounting, or financial advice. None of the content or communication from Skip the Jargon or our media platforms constitutes financial or professional advice. None of our content should be relied on for investing, tax, legal, or financial advice. Skip the Jargon is not liable for any losses to any parties.
 | A guest post by
|